Fear and Greed Index Explained: What It Tells You About the Market
Written by Arbitrage • 2025-05-28 00:00:00
Markets aren't always rational. In fact, they are often driven by two powerful emotions: fear and greed.
When prices rise, people rush to buy in. When prices fall, panic takes over. That's why understanding market sentiment is just as important as analyzing fundamentals or chart patterns. And few tools give a clearer snapshot of investor emotion than the Fear and Greed Index. In this post, we'll break down what the Fear and Greed Index actually measures, how it works, and how smart investors use it to stay one step ahead of the crowd.
What Is the Fear and Greed Index?
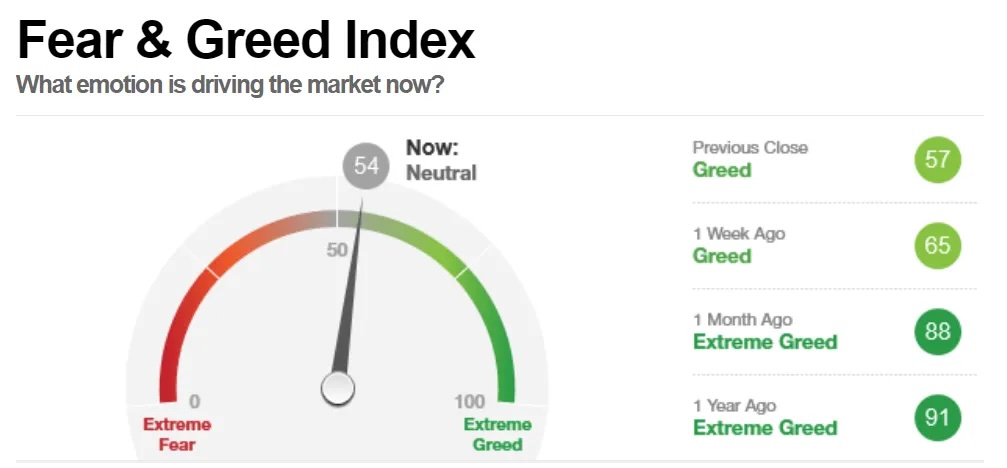
The Fear and Greed Index, created by CNN Business, is a simple yet powerful indicator that measures what emotion is driving the market right now - fear or greed. It scores the market on a scale from 0 (Extreme Fear) to 100 (Extreme Greed), based on seven underlying indicators. The idea is straightforward:
- Extreme fear can signal that investors are too worried - possibly creating buying opportunities.
- Extreme greed can suggest the market is overbought - potentially signaling a correction.
In short, it is a sentiment meter for the entire market.
The 7 Indicators Behind the Index
The Fear and Greed Index isn't just a vibe check. It is built from real market data across seven different metrics:
- Stock Price Momentum: Looks at the S&P 500 versus its 125-day moving average. Are stocks running hot or cooling off?
- Stock Price Strength: Measures how many stocks are making 52-week highs versus lows.
- Stock Price Breadth: Tracks the volume of advancing stocks versus declining ones.
- Put/Call Options: Shows if investors are hedging (fear) or speculating (greed) through options.
- Market Volatility (VIX): High VIX = fear, while low VIX = complacency or greed.
- Safe Haven Demand: Compares stock versus bond performance. Are investors seeking safety?
- Junk Bond Demand: Risk appetite indicator. High demand = risk-on greed, while low = risk-off fear.
Each one is scored individually, and then averaged to form the final index value.
What the Index Actually Tells You
At its core, the Fear and Greed Index helps you answer one key question: Are investors being too emotional right now?
- When the index is above 80, it suggests greed is dominating. People are chasing returns, and risk is being ignored.
- When the index is below 20, fear is in control - panic selling, capitulation, and flight to safety.
These extremes don't always mark precise tops or bottoms, but they do hint at potential turning points. And if you're a contrarian investor, this is where things get interesting.
How Traders and Investors Use It
- Contrarian Timing: Extreme fear? That's often when smart money starts buying. Extreme greed? Time to tighten risk.
- Risk Management: A high reading might mean it's time to reduce exposure, hedge, or raise cash. A low reading might justify taking calculated risks.
- Emotional Check-In: It is easy to get caught up in the market's mood. The index reminds you to zoom out and look objectively.
- Confirmation Tool: Combine it with your technical or macro setups. If your charts say "buy" and the index is showing extreme fear, that's conviction.
Real-World Examples
Let's look at two key moments where the Fear and Greed Index hit extremes:
- March 2020 (COVID crash): The index hit single digits as panic gripped the market. That extreme fear preceded one of the biggest bull runs in history.
- Late 2021 (peak euphoria): The index surged above 90. Meme stocks were mooning, crypto was on fire, and everyone was "all in." What followed? A major drawdown.
While it is not a precise market-timing tool, it often aligns with major sentiment shifts that precede reversals.
Final Thoughts
The Fear and Greed Index is one of those rare tools that's both simple to understand and incredibly useful. It distills the emotional pulse of the market into a single number - giving you a quick read on whether investors are acting rationally or emotionally. And that matters, because markets often turn when emotion peaks.
So the next time you're unsure whether to buy the dip or take profits, check the index. It won't make the decision for you, but it might just stop you from following the herd off a cliff.