The Late Cycle Playbook: What to Buy, What to Ditch, and When to Get Out - Part 1
Written by Arbitrage • 2026-03-18 00:00:00
The business cycle doesn't die suddenly. It telegraphs its exit weeks, sometimes months, in advance. Oil spikes. Defensives quietly outperform. Gold breaks records. And most investors - focused on the headline index - don't notice the rotation happening underneath until it's too late.
Understanding where you are in the cycle isn't academic. It's arguably the highest-leverage decision you can make as an investor. This is your playbook for the late cycle - what it means, how to spot it, what wins, what doesn't, and critically, when to get out.
What is the Business Cycle?
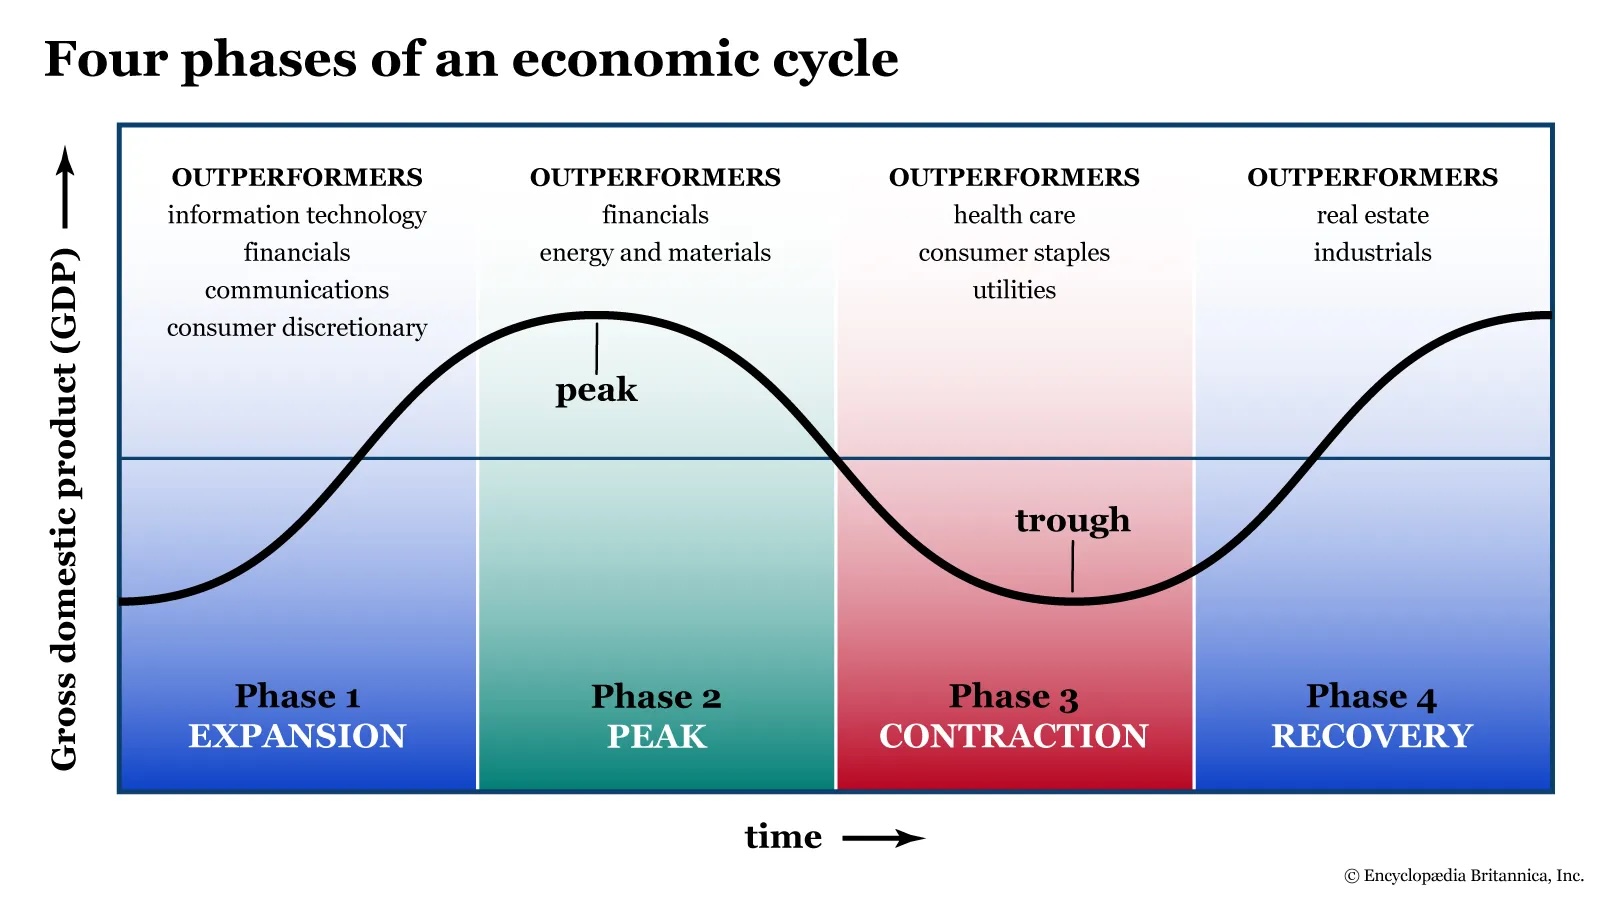
The economy doesn't move in a straight line. It expands, peaks, contracts, and recovers in a recurring pattern known as the business cycle. There are four distinct phases:
| Phase | Characteristics | Average Duration |
| Early (Recovery) | GDP rebounds, rates low, credit loosens, animal spirits returning | 1-2 years |
| Mid (Expansion) | Growth accelerating, earnings strong, employment rising, rates normalizing | 3-5 years |
| Late Cycle | Growth slowing, inflation elevated, credit tightening, margins compressing | 1-2 years |
| Recession | GDP contracting, unemployment rising, earnings collapsing, central banks cutting | 6-18 months |
The late cycle is the most misread phase. Growth is still positive - GDP is above zero, unemployment is low, earnings are still being reported. On the surface, everything looks fine. But under the hood, the pressures are building, and the market is already pricing in the turn.
The Signs You're in a Late Cycle
No single indicator confirms late cycle. It's a constellation of signals. And right now, several are flashing simultaneously.
- GDP Growth: Positive but Decelerating - The economy is still expanding, but the rate of change is rolling over. Growth surprises are turning negative. Analysts keep revising estimates down.
- Labor Market: Fully Stretched - Unemployment near historic lows sounds like good news. But a fully employed economy means wage pressures are elevated, margins are being squeezed, and there's little slack left to absorb shocks. It's a sign the cycle is mature, not healthy.
- Central Banks: At or Near Peak Rates - Rate hikes are done or nearly done. But cuts haven't arrived yet. The Fed has been on pause since December 2024 - historically, extended pauses at peak rates are when gold outperforms and equities become more volatile.
- Credit Spreads: Beginning to Widen - Credit markets are forward-looking. When spreads begin expanding - even subtly - it signals that lenders are pricing in higher default risk. Watch investment-grade and high-yield spreads as early warning systems.
- Yield Curve: Flat or Inverted - An inverted yield curve has preceded every U.S. recession in modern history. When short-term rates exceed long-term rates, it reflects the market's expectation that growth is peaking and rate cuts are coming.
- Corporate Profit Margins: Peaking and Rolling Over - S&P 500 net margins hit a record 13.9% in 2021. By 2024, excluding the Magnificent 7, the broader index saw earnings growth of just -0.5%. Late cycle means the easy earnings growth is behind us. Margins compress as input costs rise faster than pricing power.
- Consumer Confidence: Softening - Consumer confidence has declined for 10 consecutive months as of late 2025. When the consumer starts pulling back - even before a recession - it's the market telling you the expansion is long in the tooth.
KEY SIGNAL: Oil Spiking - When energy prices surge late in an expansion, it's historically one of the clearest late-cycle signals. Demand is still elevated, supply constraints bite, and energy companies report record profits. The spike itself then becomes recessionary, acting as a tax on consumers and businesses simultaneously. Watch oil not just as a commodity, but as a cycle clock.
What the Market is Already Doing
Here's where it gets interesting: the rotation is happening in real-time. You don't have to predict the late cycle - the market is already voting on it with capital flows.
Q1 2025 S&P 500 Sector Returns:
| Sector | Q1 2025 Return | Signal |
| Energy | +9.3% | late cycle outperformer |
| Healthcare | +6.1% | defensive rotation underway |
| Consumer Staples | +4.6% | defensive rotation underway |
| Utilities | +4.1% | defensive rotation underway |
| S&P 500 (Index) | -4.6% | broad index sold off |
| Information Technology | -12.8% | growth unwind accelerating |
| Consumer Discretionary | -14.0% | cycle-sensitive selling off |
This is textbook late-cycle rotation. The four sectors holding up (Energy, Healthcare, Consumer Staples, and Utilities) are precisely the sectors that historically outperform when growth is decelerating. Meanwhile, the two sectors being hammered (Tech and Consumer Discretionary) are exactly what you'd expect to underperform as rate sensitivity and margin compression bite.
And then there's gold. In 2025, gold rose from $2,600/oz to a record high above $4,300 - its biggest annual gain in 46 years. As of March 2026, it's trading around $5,000/oz. Gold set 53 new all-time highs across 2025 alone. This is not a routine commodity move. Historically, gold outperforms during Fed pauses at peak rates, when financial conditions tighten and uncertainty builds. J.P. Morgan is now forecasting $5,000/oz by end of 2026. The smart money is already positioned.
Come back tomorrow for Part 2 of this topic!