The Taylor Rule: How a 1993 Formula Still Frames Every Fed Decision - Part 1
Written by Arbitrage • 2026-08-18 00:00:00
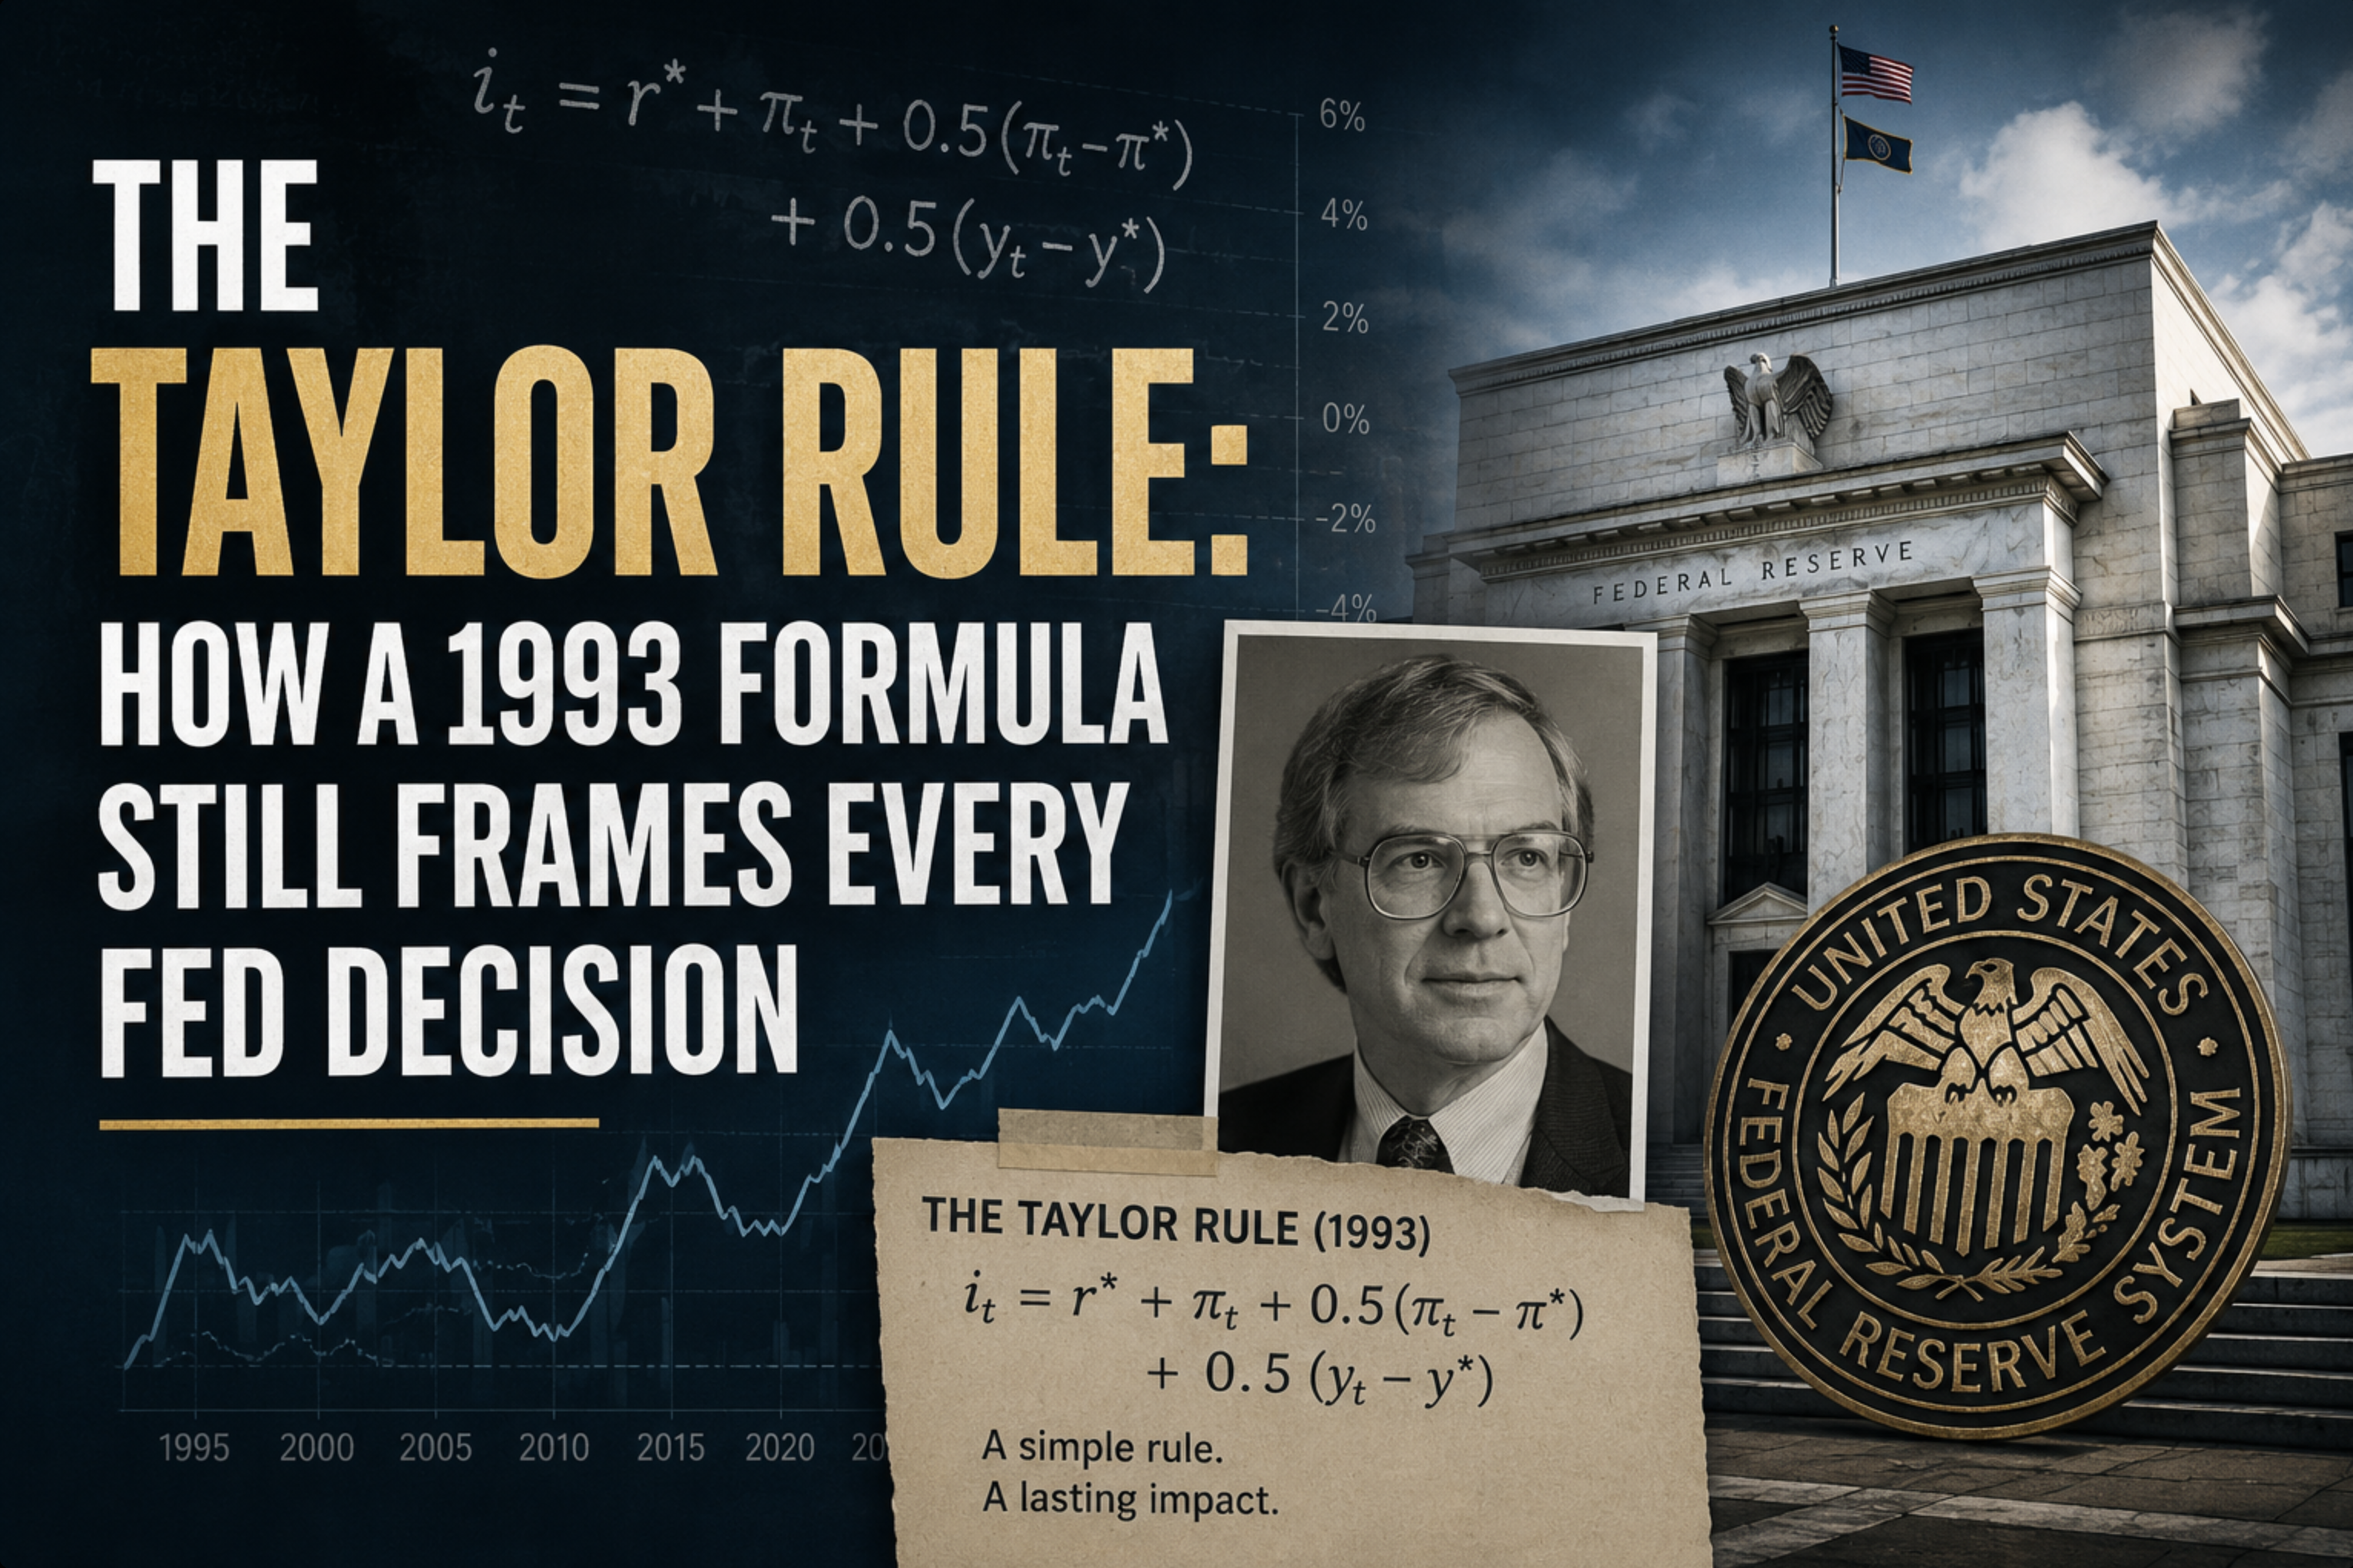
The formula in the room Ask any Fed official whether the central bank follows a rule, and you'll get a firm no. Policy is set by a committee weighing dozens of inputs, they'll say, not by plugging numbers into an equation. And yet the same officials reference one particular equation in their speeches, cite it in the Monetary Policy Report, and reach for it when they want to explain whether rates sit in the right neighborhood. Analysts do the same. So do portfolio managers trying to judge whether policy is working with them or against them.
That equation is the Taylor Rule. It's been in the room for more than thirty years, and it still frames the conversation. This piece isn't about what the Fed should do next. It's about the benchmark professionals use to gauge how far current policy sits from a neutral reference point, and how to read that distance as a condition rather than a signal.
Where it came from
John Taylor, then an economist at Stanford, presented the rule in a 1993 paper with a dry title: "Discretion versus Policy Rules in Practice." The paper's surprise wasn't that Taylor told the Fed what to do. It was that he described what the Fed was already doing. Taylor took a simple formula, fed it inflation and a measure of economic slack, and plotted the result against the actual federal funds rate from the late 1980s into the early 1990s. The two lines tracked each other closely. The implication landed hard: a central bank that insisted on discretion was behaving, in practice, as if it followed a rule. That single chart is why a short academic paper became one of the most cited ideas in modern monetary policy.
The formula, decoded
Here's the classic 1993 version:
Federal funds rate = r* + inflation + 0.5 (inflation minus target) + 0.5 (output gap)
- The neutral starting point (r* + inflation). r* is the natural real interest rate, the rate that neither stimulates nor restrains the economy when everything is balanced. Taylor set it at 2 percent. Add current inflation, and you get the neutral nominal rate, the anchor the rest of the formula adjusts around.
- The inflation gap (inflation minus target). How far inflation sits above or below the 2 percent goal. Run hot, and this term pushes the prescribed rate up.
- The output gap. How far the economy sits above or below its sustainable capacity. Above potential pushes rates up, below potential pulls them down. In practice, this often gets proxied through the unemployment rate using Okun's law.
- The two 0.5 coefficients. These say the Fed leans against inflation and against the output gap with equal weight. Nudge either term, and the rate responds by half as much.
Strip away the notation and the intuition is almost mundane: when the economy runs hot or prices climb above target, the rule calls for higher rates, and when things cool, it calls for lower ones. Lean against the wind. That's the whole idea, and it's why the rule feels like common sense once it's unpacked.
The two assumptions that do the heavy lifting
Here's the catch. Two of the inputs can't be observed. They have to be estimated, and the estimates are where most of the disagreement lives.
The first is r*, the neutral real rate. Nobody can measure it directly. Taylor used 2 percent. The New York Fed's Laubach-Williams model has estimated it closer to 1 percent in recent years. That difference sounds small until you run it through the formula, where it moves the prescribed rate one for one. A full point of disagreement about r* is a full point of disagreement about where policy should sit.
The second is the output gap, or its cousin the unemployment gap. Potential output is also unobservable, and the official estimates get revised well after the fact. The number you use today may look different a year from now once the data settles.
So the honest takeaway is this: the rule's output is only as reliable as two inputs that nobody can pin down in real time. This is also why two careful forecasters can look at the same economy and land on Taylor Rule prescriptions a full percentage point apart. They're not disagreeing about the arithmetic. They're disagreeing about r* and potential.
Come back tomorrow for Part 2 of thus topic!
This material is provided for informational and educational purposes only and reflects observations of market conditions and patterns. It does not constitute investment advice, a recommendation, or an offer or solicitation to buy or sell any security or financial instrument. All examples are illustrative. Past patterns are not indicative of future results. Readers should conduct their own analysis and consult a qualified professional before making any financial decision.