The Memory Cycle: How Boom Builds the Bust - Part 1
Written by Arbitrage • 2026-07-07 00:00:00
The Paradox on the Tape Micron spent most of its corporate life as the kind of stock nobody bragged about. It made memory chips, the prices rose and fell, and the equity went along for the ride. Over the past twelve months that quiet name has run something close to 700 percent, pushed past a trillion dollars in market value, and parked itself among the most valuable tech companies in the country.
The explanation showing up in almost every writeup is some version of "this time is different." The argument goes that AI has turned memory from a commodity into a strategic asset. High-bandwidth memory is sold out for the year. Hyperscalers are locking in supply through multi-year agreements. Revenue visibility now stretches further than it ever has for a memory maker. There is a quieter counterpoint coming from people who've watched this industry since the 1980s. One Harvard supply-chain professor, asked about the run, offered a line that lands harder the longer you sit with it. Anytime someone shows him a curve that goes straight to the sky with no end, it never lasts. "This too will pass," he said.
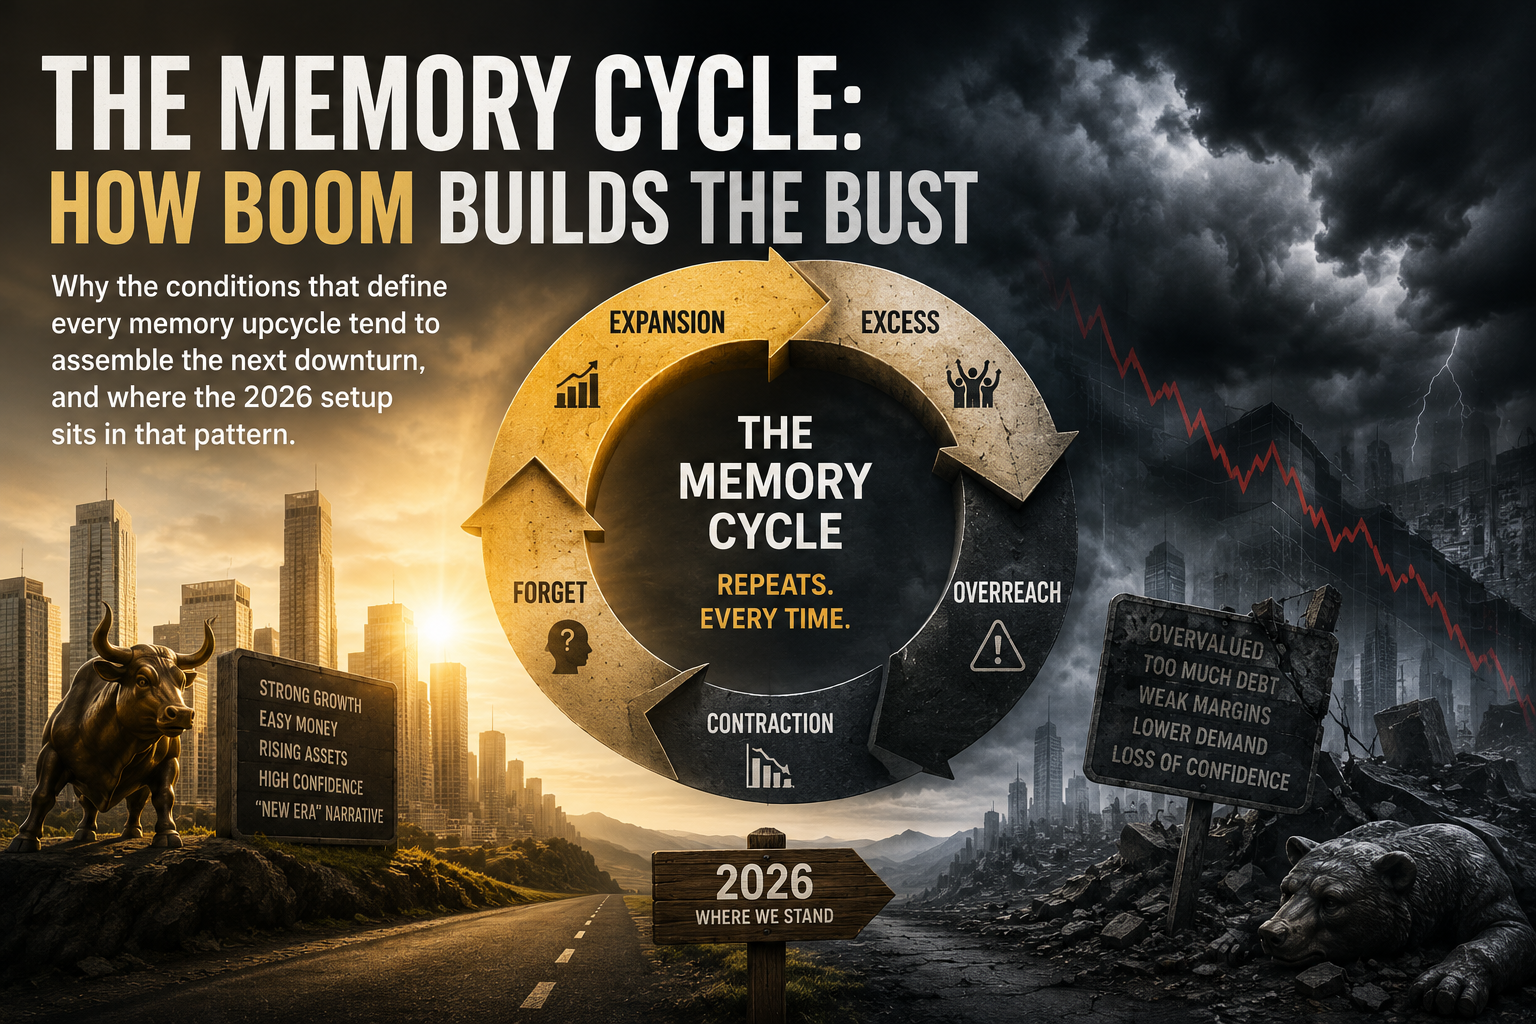
So here's the question worth sitting with. Is the boom itself quietly building the conditions for the next bust? That's not a prediction. It's a pattern, and memory has run this pattern more times than almost any other corner of the market.
What a Memory Cycle Actually Is
Start with the product. DRAM and NAND flash are about as close to commodities as anything in technology gets. A gigabyte of DRAM from one of the three big makers does roughly the same job as a gigabyte from another. When the thing you sell is interchangeable, the market clears on price, and price becomes the variable that swings.
Then look at who makes it. Three companies, Micron, SK Hynix, and Samsung, control the overwhelming majority of DRAM production. Building the capacity to make these chips is brutally capital-intensive. A modern fab costs tens of billions and takes years to design, build, and bring to full output.
That combination, a commodity product plus enormous lumpy capacity additions, is the engine of the cycle. Demand for memory moves more or less continuously. Supply arrives in giant discrete steps, each one the result of an investment decision made years earlier when conditions looked very different. The gap between smooth demand and lumpy supply is the thing that produces the boom and the bust. It isn't a flaw in the industry. It's the structure of it.
The Four Phases, and How Each Seeds the Next
A memory cycle tends to move through four recognizable phases, and the interesting part is how each one creates the conditions for the one that follows.
- The build-out. Prices are high and margins are fat. Every maker looks at those margins and reaches the same conclusion at the same time: build more. Capacity gets ordered. The seeds of oversupply go in the ground precisely when business has never looked better.
- The debt and capex overhang. Fabs have to be funded. Capital budgets balloon, balance sheets stretch, and fixed costs ratchet up. Micron has guided fiscal 2026 capital spending toward roughly 20 billion dollars. Those commitments get made against today's pricing, but they pay off, or don't, against tomorrow's.
- The swing up in stock prices. Equities don't wait for the cycle to play out. They front-run it. Multiples expand, and the market begins to re-rate a cyclical commodity producer as a structural winner. The story shifts from "memory is volatile" to "memory is different now." That re-rating is a feature of the top, not a refutation of it.
- The fall. New capacity finally lands, and it tends to land into demand that's already softening. Pricing rolls over. The operating leverage that made the boom so spectacular runs in reverse, turning record profits back toward losses with the same speed it produced them. The richer the build-out, the harder the correction. The boom builds the bust.
What the Cycle Looks Like in the Numbers If you've never traded a full memory cycle, here's the shape it tends to leave behind.
On the chart, the signature is a long flat base, then a near-vertical advance, then a sharp reversion. The move up feels unstoppable right up until it stops.
In the earnings, the pattern is even more violent than the price. Memory makers can swing from losses to record profits and back, because fixed costs are so high that small moves in selling price land almost entirely on the bottom line. That operating leverage cuts both ways, which is exactly why the swings are so wide.
The tells worth tracking tend to lag the narrative. The spread between contract pricing and spot pricing often turns before the headlines do. Capacity announcements pile up near the top. Inventory days start creeping. And the gap between the demand story and the bits actually shipped tends to widen quietly before it matters loudly. None of these is a timing signal on its own. Together they describe where in the rhythm you might be standing.
Come back tomorrow for Part 2 of this topic!
This piece is illustrative market analysis and pattern recognition, not investment advice or a recommendation to buy or sell any security. Names are referenced to illustrate cyclical dynamics, not as directives. Examples are illustrative only. Conditions described may change without notice. Arbitrage Trade and its contributors may hold positions in securities mentioned.